

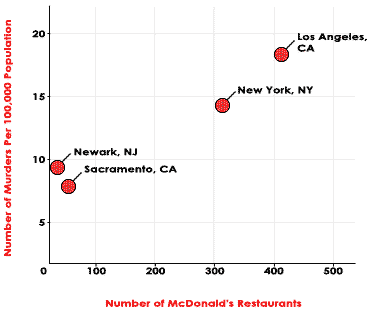
From our statistical analysis, we have determined that cities with a larger number of McDonald's restaurants were host to more murders per 100,000 people. Coinicidence? They would like you to think so. The figures below illustrate the pattern that has appeared on both sides of the United States.
 |
||||
| City | Total Population | Total Murders | Murders per 100,000 People | Number of McDonald's Restaurants Present |
| New York, NY | 7,319,546 | 1,220 | 14.2 | 312 |
| Newark, NJ | 260,232 | 175 | 9.0 | 10 |
| Los Angeles, CA* | 3,466,211 | 1,682 | 18.3 | 410 |
| Sacramento, CA | 375,845 | 114 | 7.9 | 30 |
|
Our information was collected from City Crime Rankings 1995 statistics, published by Morgan Quinto Press in Lawerence, Kansas in 1997, and a search of McDonald's restaurant locations at vicinity.com/mcdonalds. * Population and crime data includes Long Beach, CA. |
||||
The Story | Statistics | Coverup | Contribute | Home